AI Infographic Generator
Create stunning infographics from text and data. Visualize complex information instantly with our AI generator on an infinite canvas.
Why choose our AI Infographic Generator?

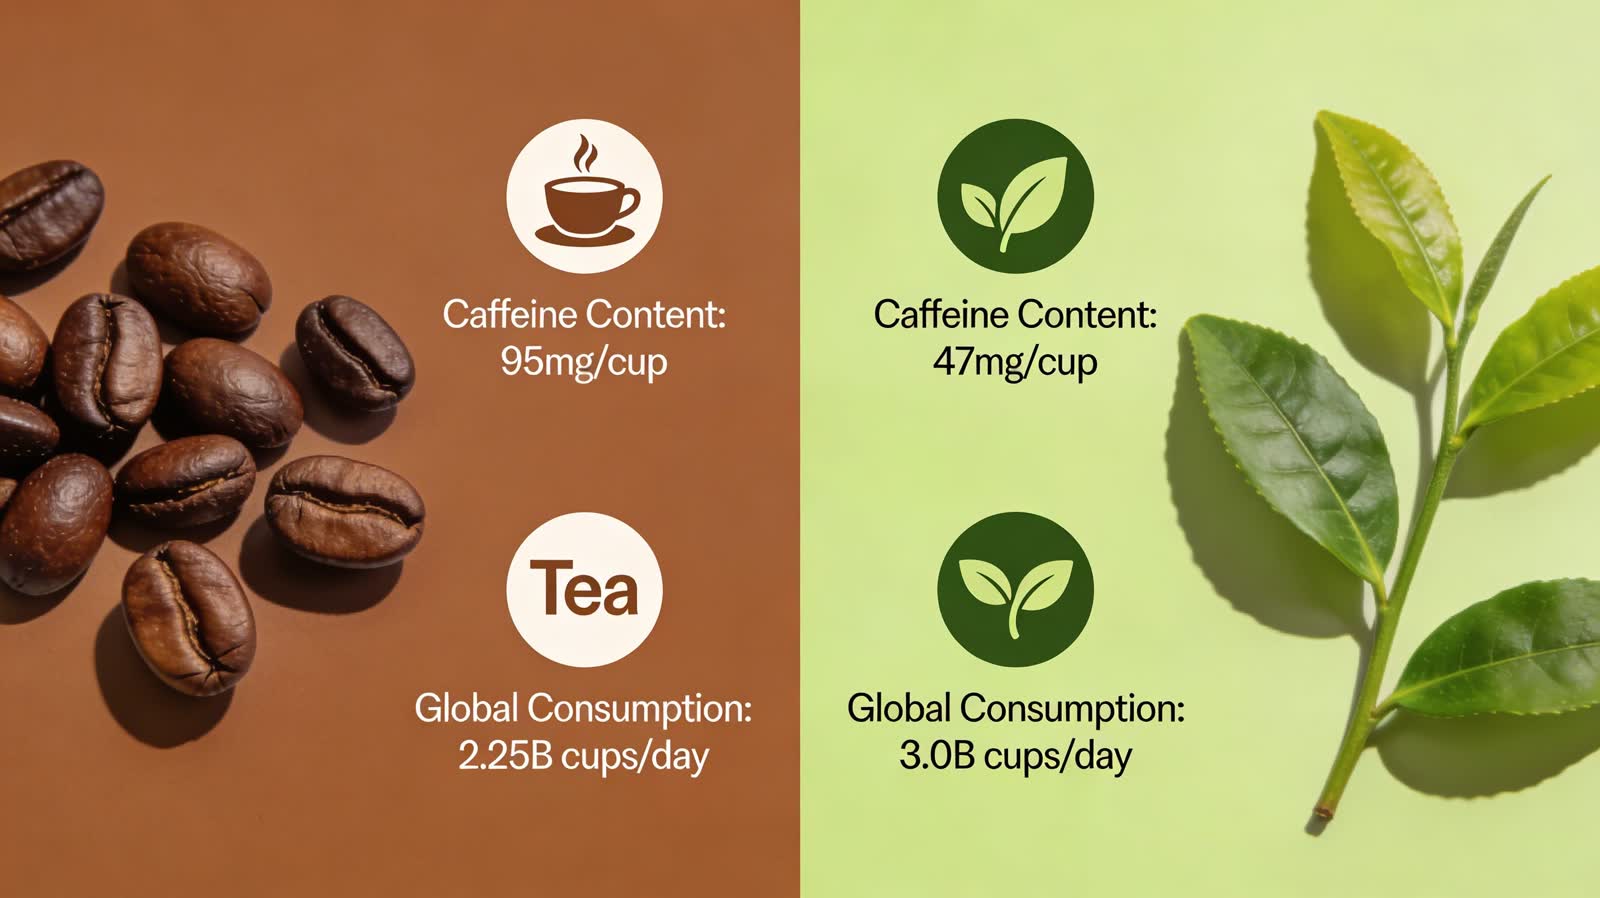
Data Visualization
Transform raw numbers into clear, beautiful charts. Generate bar graphs, pie charts, and timelines that are easy to read and visually consistent with your brand.
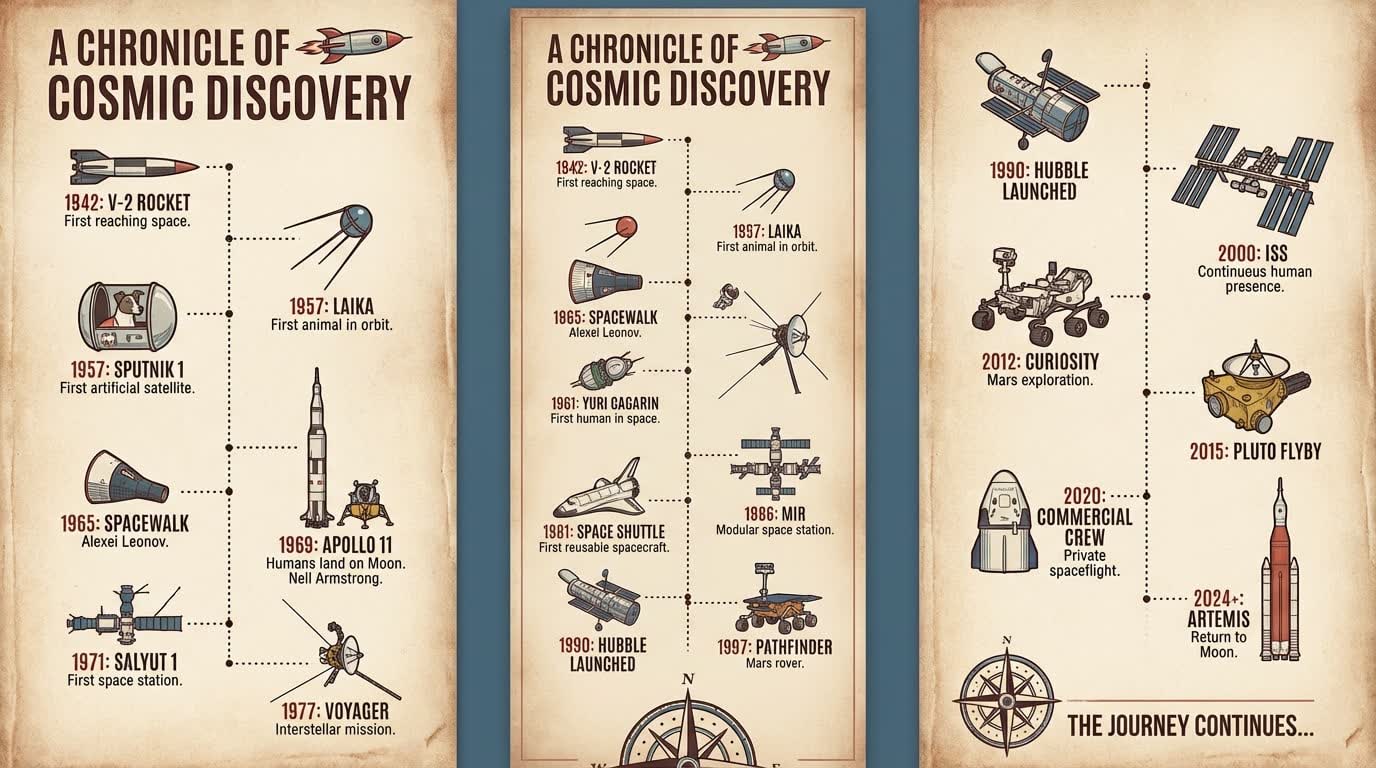
Process Flows
Explain complex systems simply. Create flowcharts, diagrams, and step-by-step guides that break down complicated information into digestible visuals.
Custom Layouts
Forget rigid templates. Our AI generates unique layouts tailored to the amount of content you have, ensuring everything fits perfectly without overcrowding.
Who is it for?
For Marketers
Create shareable content that drives traffic. Infographics get 3x more likes and shares on social media.
For Educators
Make learning visual. Turn textbook concepts into engaging posters and study aids.
For Consultants
Present data with impact. Turn boring reports into compelling visual presentations for clients.
AI Infographics vs Traditional Design
Manual Design
Flowith AI
Layout Design
Manually arranging data points and icons takes hours.
AI auto-generates professional layouts optimized for your data.
Data Visualization
Creating charts in Excel and importing them breaks the design flow.
Generate beautiful charts and graphs directly from your data on the canvas.
Style
Hard to make dry data look engaging and on-brand.
Apply consistent, attractive visual styles to make data pop.
Storytelling
Focusing on design often leads to losing the narrative.
AI helps structure your information to tell a compelling visual story.
How to create infographics in 3 steps?
Input Data
Paste your statistics, text, or upload a dataset you want to visualize.
Select Style
Choose a visual theme (e.g., Corporate, Minimalist, Colorful) or describe your brand style.
Generate Infographic
The AI arranges your information into a stunning visual story. Edit and export instantly.
Frequently Asked Questions
Start designing infographics today
Join our growing community of creators using Flowith AI.